HTML5 Web-viewer for pointcloud data
Background
I worked with a lot of point cloud data the last two years. Our primary source was a LiDAR scanner that created point clouds of the interour of homes and apartments. We used this data in a couple of different research projects. However, we usually displayed the data using specialized VR display equipment, either our CAVE or the Oculus Rift. Even on the desktop we used powerful computers to visualize it.
Reading up on the new features of HTML5, especially WebGL, I became interested in designing and implementing a viewer in native code. The advantages would be the complete independence of platform specific code (everything in a webpage)
Implementation
WebGL is more limited than standard OpenGL, however, we can draw out rendering over multiple frames (unlike in desktop/VR rendering). I implemented a progressive rendering method that provides a high frame rate for navigation but continually adds new detail to the scene once the view is stable.
An octree is used as spatial subdivision structure. Each node stores at max 65k points (the max number of vertices for a WebGL indexed draw submission). The octree is created recursively: the points of each node are shuffled and then split into 8 children. A node only gets split if there are enough points to do so (a fixed parameter). We also leave the max number of points in the node about to split, this allows mip-mapping techniques. Furthermore, the octree is tightly bound, that is the bounding boxes for each child get recalculated after each split. Each node becomes a separate binary file. Finally a json file is created that stores the tree structure as well as all node file names.
The tree is used for view-frustum culling, progressive loading and rendering and mip-mapping. After the camera stopped moving, the visible nodes are determined recursively and placed on the visible list. The list is ordered front-to-back and then each node gets drawn. A variable number of nodes gets drawn per frame, based on a max number of drawable points. Once this number is reached, rendering pauses for this frame and will continue during the next frame. This guarantees a responsive application. A secondary thread accesses the visible list and checks if the visible nodes have been read from file already. If not, the node is marked and gets loaded through an asynchronous XHTML data request. Note that this is independent and still runs if the node should become invisible (eg through camera movement) in subsequent frames.
Progressive rendering requires single-buffered rendering, however different browsers implement that differently (or not at all). The solution to that problem was to render the result to a frame buffer object render target that gets cleared only on request. It can then be drawn using double-buffered rendering and a full-screen quad without problems. Furthermore, FXAA anti-aliasing is employed to draw the result on-screen to smoothen the sometimes noisy results of LiDAR-scanned point clouds. During camera movement the resolution of the FBO is also halved, resulting in an increased frame rate and more responsive system.
Demos
We build (and still are building) an online database of point cloud data which can be explored using only the brower. This link takes you right to it. Two demos are here on this site:
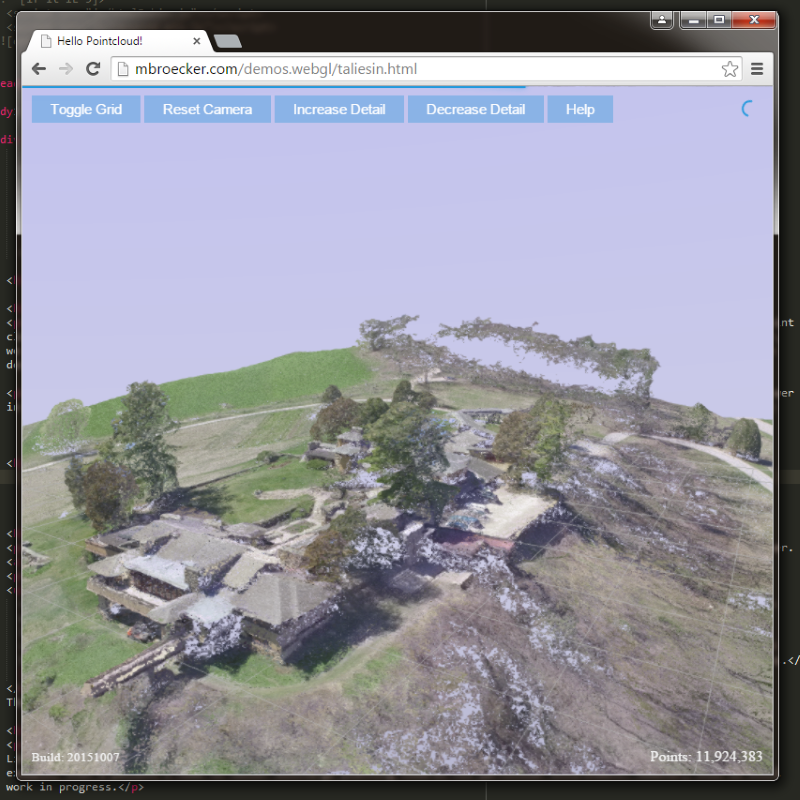
Reconstruction of Taliesin, Frank Lloyd Wright's school, living complex and work space in Spring Green, WI. The data was created by extracting still images of 4k videos shot with a DJI Inspire1 drone flying over the complex in early 2015.
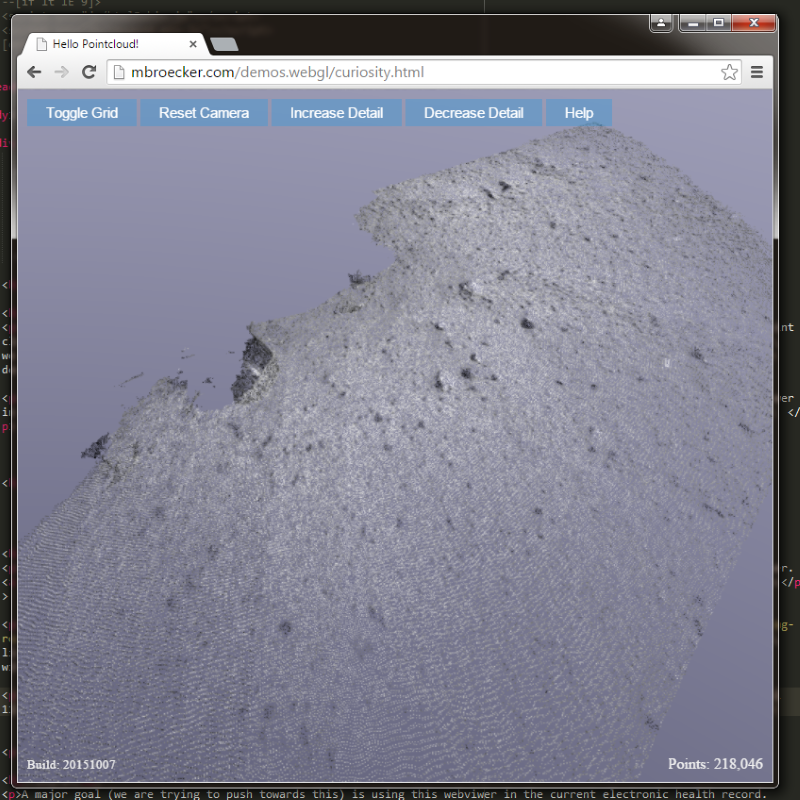
Reconstruction of Martian terrain around NASA's curiosity rover around Sol 1112. These have been created from the many cameras around the rover, especially from the two navigation cameras. The input images were grayscale so the nice reddish tint of the martian soil is missing in this shot.
The current implementation of the web viewer runs best in chrome and in a recent version of Firefox.
Future
A major goal (we are trying to push towards this) is using this webviewer in the current electronic health record. LiDAR data is already part of extensions to the DICOM standard. It should not be too far off that we can could, for example, scan a patient's home to tailor discharge planning towards his particular environment. However, this is still work in progress.
Source Code
You can clone/fork the project on Github.