Visualization of Cluster Log Data
The university runs a high-throughput cluster system which is part of the international science grid. The job scheduler used is CondorHT. There are many different computer pools at the university, each with changing size and load, depending on the job load and time of day.
The current visualization was a 2D grid of cells, each cell representing an active node in the pool. The color of the cell indicates the load (from low (red) to high (blue-green)) and some common jobs were identified by simple icons.
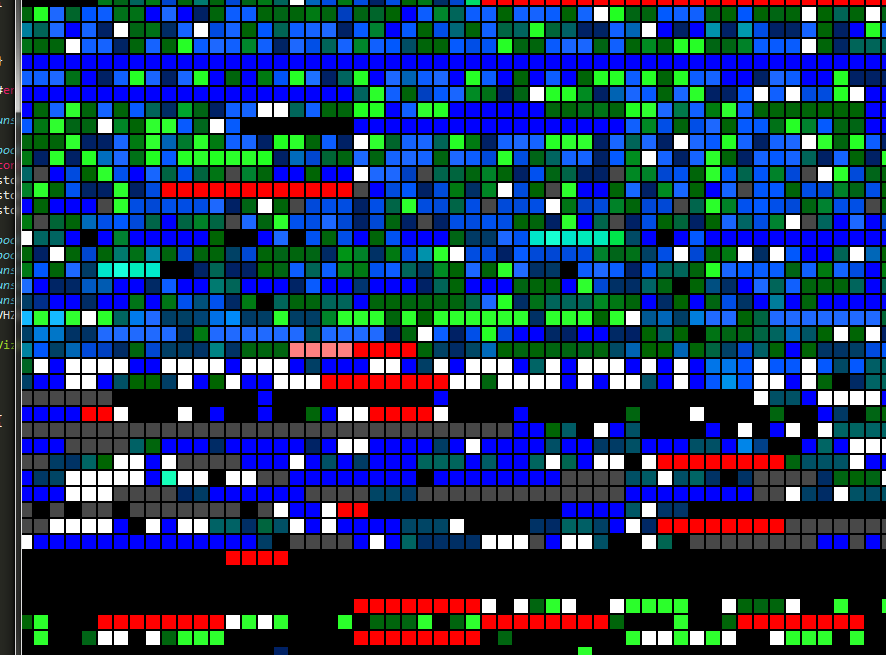
Cluster Log Data
The log data of the cluster was very hierarchical. Available computers are grouped into pools, usually by the physical location on campus or assignment to a research lab. Each computer has a number of available nodes, usually one per CPU which can run jobs. Jobs can be split over multiple nodes and have attributes such as owner, timing, etc. Each node additionally has a 'load' which describes how well the CPU is used.
Visualization
I wanted the visualization to resemble those 80s/90s cyberpunk ideas how a computer system looks like. I thought of those virtual neon-lit city blocks -- this fit well with the hierarchical structures of the cluster. Each computer became a skyscraper, the number of nodes describing its height. Powerful computers are tall skyscrapers, more standard ones smaller buildings. Next, these computers are grouped by their pools -- neighbourhoods began to develop with high-rises in some small neighbourhoods and more pedestrian lower but large suburban neighbourhoords.
-
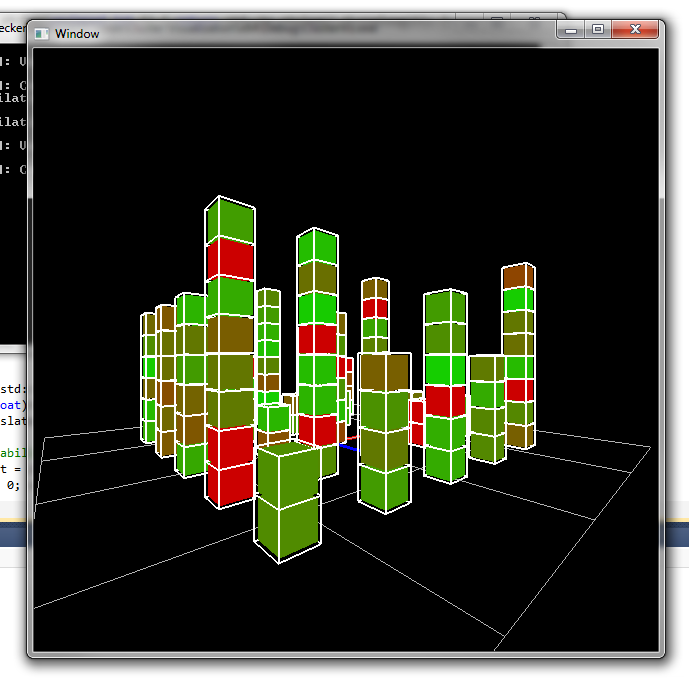
First prototype
Each node belonging to the same (physical) computer is stacked together to build these towers. The cells still show the current load through color. -
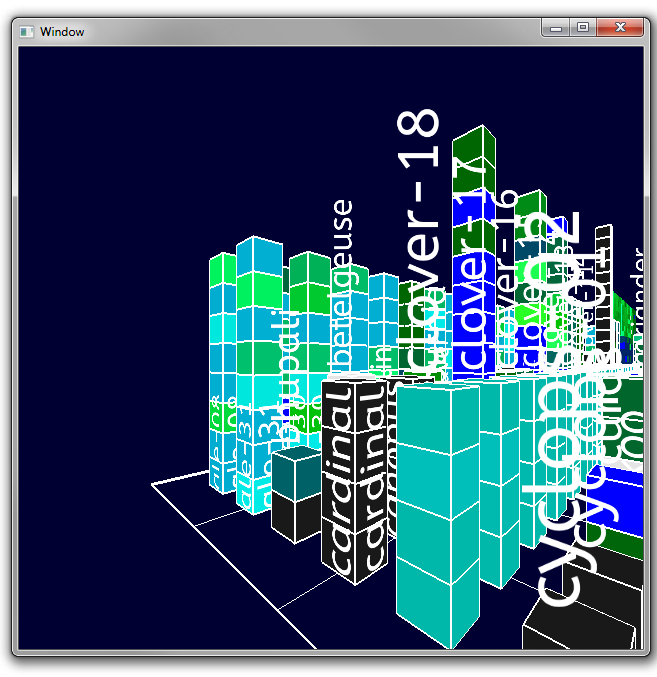
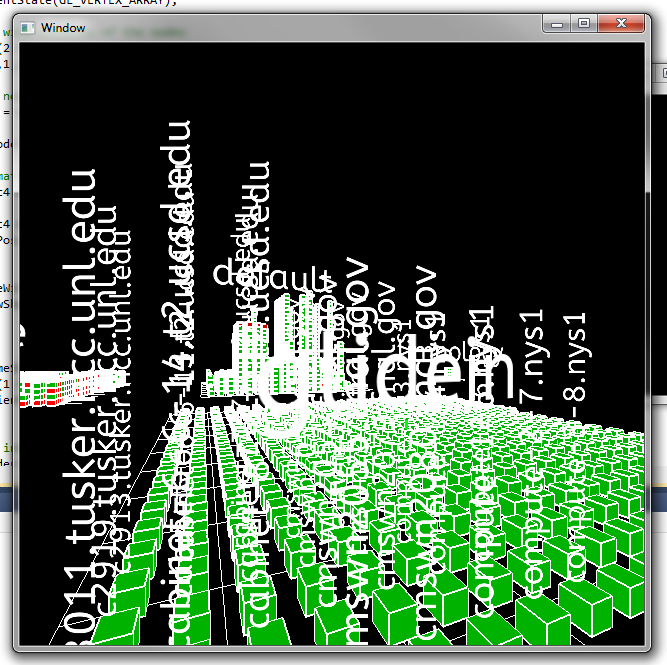
Text rendering
Text rendering was implemented next. I used Freetype and FTGL to render 3D text of each node's name. If the stack is high enough, the name is placed flat along the two visible sides, otherwise a text billboard is floating over the stack. -
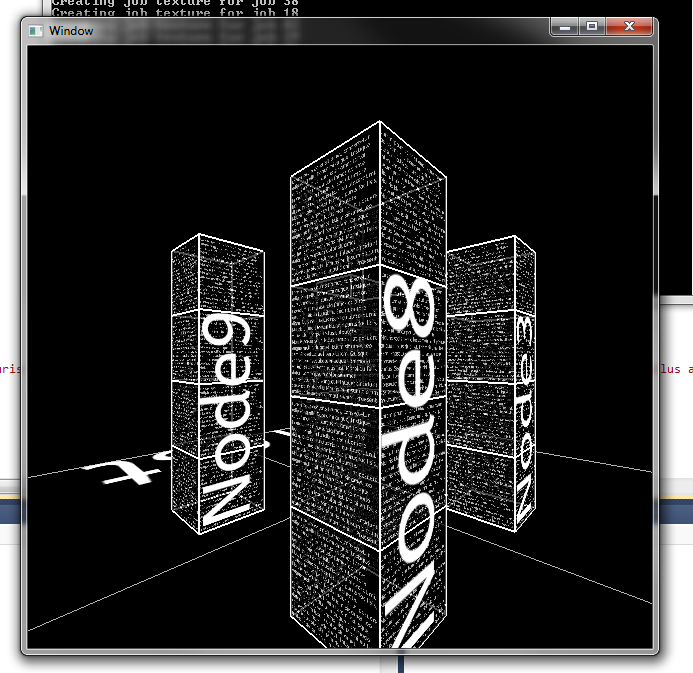 Each node also contains a lot of process and job information, such as user, timing, etc. It is possible to project a wall of text for all of these details onto the node's sides. In this case, each node has a unique texture that is written to. If a job updates with new information, the texture will be updated.
 -
 A simple LOD scheme was implemented to avoid cluttering the display (too much). Text is only drawn if the node is within a certain threshold. The pool/group names are always visible.
 -
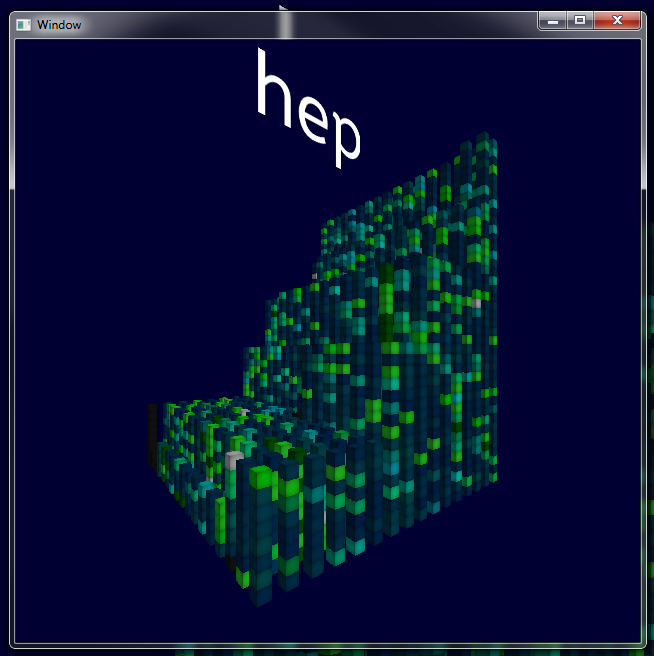
Shading
Finally, simple shading was applied to each node to highlight some detail. Each face was shaded by the squared distance from its center using texture coordinates. This creates a pleasant gradient for each side. Additional flat-faced shading can also be applied. -
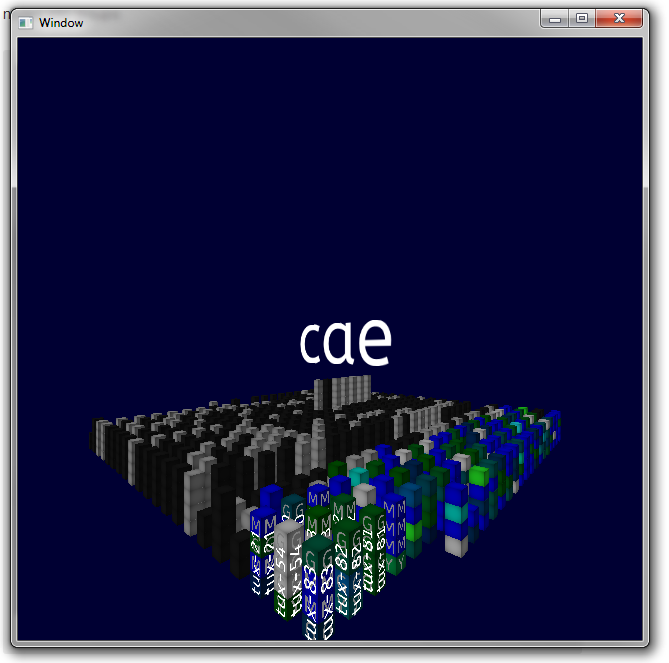
Icons
Icons of common jobs were again implemented as single letters. However, graphical icons, eg textures, are also possible. Putting all together looks like this. -
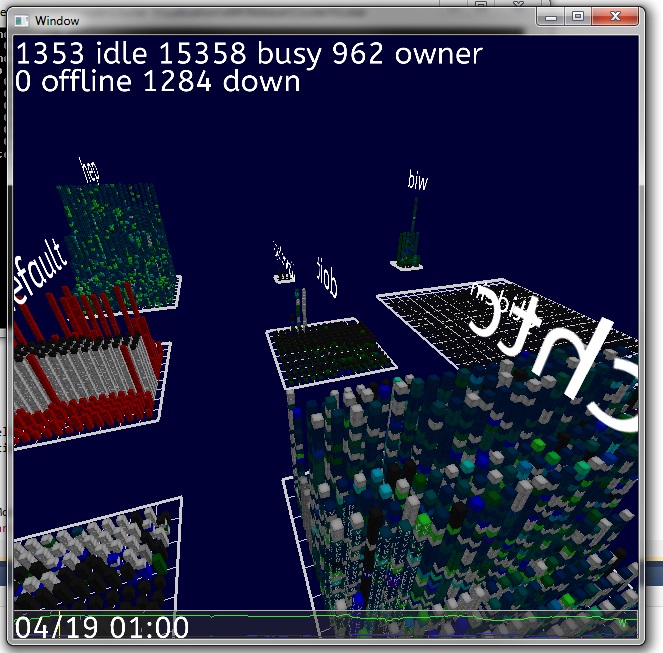
Demo mode
The logs can be viewed immersively in the CAVE, which allows navigation but also scrubbing through the log's events. An additional demo mode was also implemented. The viewpoint moves between randomly chosen viewpoints but always centers on a randomly selected pool. Additional graphs and info bars display the current time and date of the log as well as the load of the whole cluster at that point.